Palm Inspector
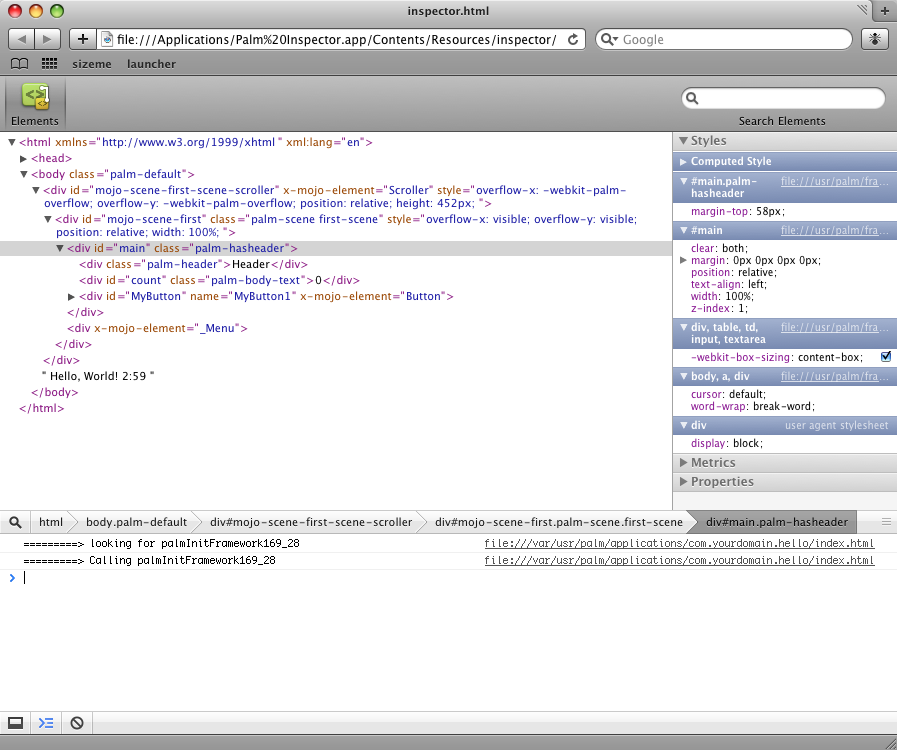
The Palm Inspector allows examination of the DOM of an application running on the emulator.
Known Issues
The following are the known issues for the Palm Inspector:
-
The inspector may not be able to connect to the emulator at times. When this occurs, restarting the emulator then the inspector may solve the problem.
-
Reload in the inspector is not supported in this release.
-
Windows – opening detail panels on the right side of the inspector may cause the inspector to stop responding and require a re-launch.
-
The inspector can only look at one stage at a time.
Running the Palm Inspector
Follow these steps:
-
Use the -i option with Palm Launch.
Example:
palm-launch -i com.example.app
Note:
When inspecting a different application or relaunching and inspecting the same application, click the refresh button in the Palm Inspector window.
-
Run the Palm Inspector application, as follows:
-
Mac: In the Applications folder, double-click Palm Inspector.
-
Windows: Select Start > All Programs > Palm > SDK > Palm Inspector.
-
The Palm Inspector window shows the elements and styles. To expand or collapse each element, click the triangle to the left of the element.
Palm Inspector Capabilities
The Palm Inspector has the following capabiities:
- Expand a frame or object element to show the DOM tree inside that element.
- Update the DOM tree when the inspected stage and scene change.
Note:
Updates can take up to a few seconds.
-
Edit a DOM element attribute by double clicking it.
-
Edit a DOM property in the Properties pane by double clicking it.
-
Enable the Inspect mode to move around the page to find a node to inspect. Click on a node in the page to focus it in the Elements panel and turn off the inspect mode.
-
Pause on an editable style rule to display the checkboxes that are for disabling individual properties.
-
Edit a style property by double clicking it, and then:
- Delete all of the text to delete the property.
- Type or paste in multiple properties to add the new properties.
-
Edit style numeric property value by:
- Using the UP ARROW or DOWN ARROW to increment or decrement the number.
- Holding ALT/Option to step by 0.1.
- Holding SHIFT to step by 10.
-
Edit any of the CSS box model metrics by double clicking it.
-
The Metrics pane now includes position info for absolute, relative, and fixed positioned elements.
Identifying Stages
When running multi-stage applications, it is helpful to be able to identify the stage to be inspected. The way to do this is as follows:
-
In Novaterm, issue the command
luna-send -i -n 1 luna://com.palm.applicationManager/running {}. -
Find the entries for your appid. The first process listed for your app is the JavaScript Process. This will only have the script and link elements. Subsequent processes are related to to active stages, usually in the order they were activated, but they are not positively identified.
- Issue the command
luna-send luna://com.palm.applicationManager/inspect '{"*processId*":"$*processId*"}'to activate inspection for the desired process.
-
Open the Inspector application.
Note that you should not run "inspect" mode from "palm-launch".