HP webOS Resource Monitor
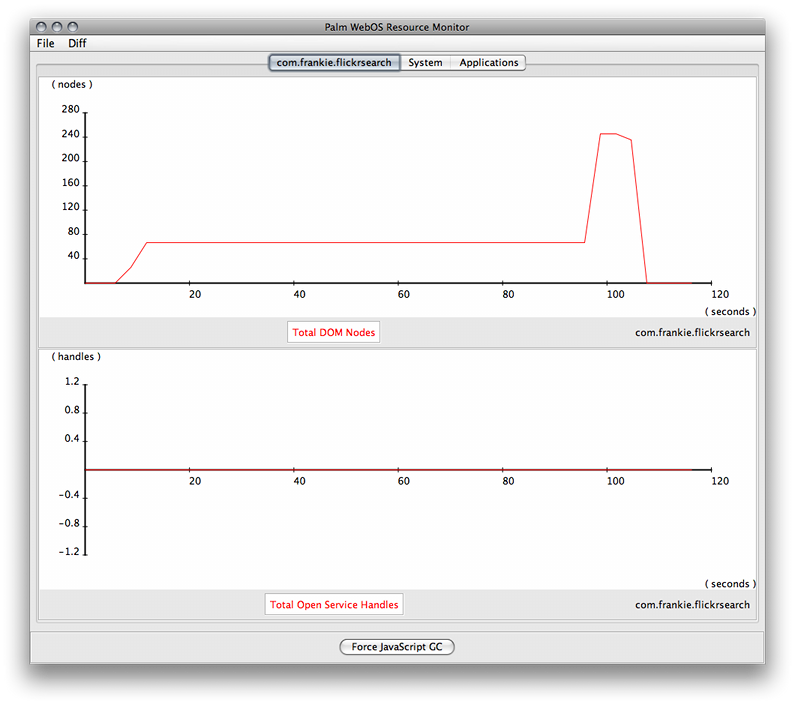
webOS Resource Monitor is a tool that graphs your application's dom node count and open service handles. This helps you determine the memory footprint of your application, as well as whether you are leaking any memory. If you leave dom nodes open after your application or scene is closed, your application is leaking memory. Typically this is caused by event handlers that remain even after a scene or application is closed.
Running webOS Resource Monitor
To start webOS Resource Monitor, run it from the command line, specifying the app id (e.g., com.mystuff.hello):
palm-worm
You can then open your application in the emulator, and watch as the data is graphed while the application runs. You should test intensive operation of your application, checking for memory leaks.
-
When closing an application, memory should return to zero.
-
When dismissing a notification in a headless application, memory should return to the baseline level the application uses in the background. This baseline should remain constant.